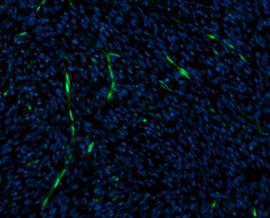
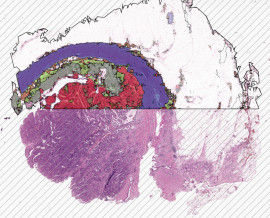
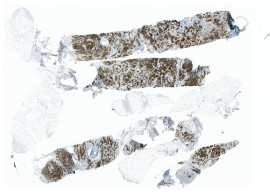
Skin cancer, particularly melanoma, remains a significant concern in oncology. Advanced techniques in derma-pathology (DP), such as multichannel fluorescence, have provided transformative insights into the cellular and molecular intricacies of skin cancer. This method, capturing multiple fluorescent signals simultaneously, offers a detailed view of the tumor microenvironment and the interactions of therapeutic agents within it.

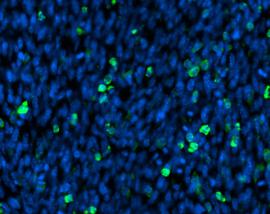
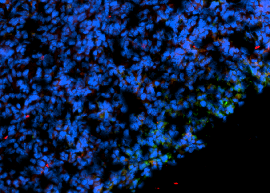
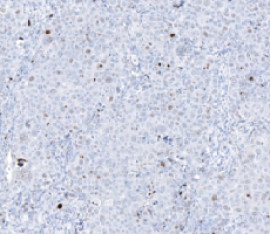
Artificial intelligence (AI) was employed to evaluate immunofluorescence staining of mouse melanoma tissue.
Key markers were identified:
- DAPI for cell nuclei,
- CD3 for general T cells,
- CD8 for cytotoxic T cells,
- CD11b for macrophages and dendritic cells,
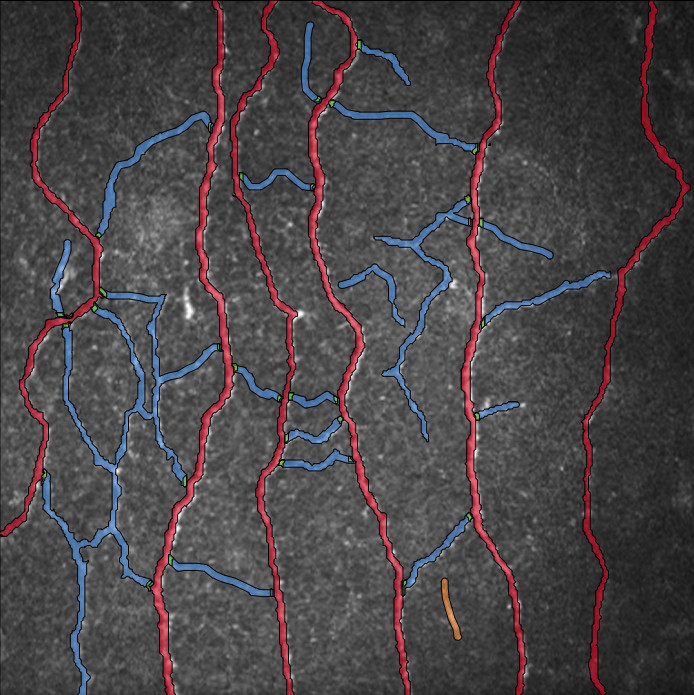
- ERG for endothelial cells,
- Ki67 as a proliferation marker.
The study categorized mouse tumors into four distinct groups based on their genetic makeup and the treatment they received, either immune checkpoint inhibitor therapy (anti-PD-1) or a placebo.
Previous research has indicated that anti-PD-1 therapy augments T cell infiltration into the tumor, particularly increasing the proportion of cytotoxic T cells. This rise, coupled with heightened CD8 cell activity, contributes to the drug’s antitumor effect. The aim is to delve deeper into the distribution of immune cells within tumors, hypothesizing that a central accumulation of these cells, as opposed to peripheral clustering, signifies enhanced antitumor activity.
Additionally, the study sought to discern alterations in macrophage populations, not just in cell count but also in cell size, by measuring cell diameter and area. Markers like ERG and Ki67 were quantified across all groups to detect variances in angiogenesis and tumor cell growth.
With the integration of AI and multichannel fluorescence in skin cancer research, there’s optimism for more targeted and effective treatments, as well as a deeper understanding of tumor dynamics and immune interactions.
Melanoma
Melanoma is the most severe form of skin cancer, accounts for only about 1% of skin cancers. However, melanoma, which means black tumor, is also the deadliest form of skin cancer. Originating from cells called melanocytes that create the pigment responsible for skin color. It can also appear in the eyes and, on rare occasions, in internal areas like the nose or throat.
While the precise origins of all melanomas are uncertain, exposure to ultraviolet (UV) rays from the sun or artificial sources like tanning devices heightens the likelihood of melanoma development. Reducing UV exposure can decrease melanoma risk There’s a rising incidence of melanoma in individuals below 40, particularly among women. Recognizing skin cancer’s early signs is crucial, as early detection and treatment can effectively combat melanoma. It’s highly treatable. In fact, it has a 99% cure rate when caught early. Early detection is key to determine the best treatment plan.
Workflow with HSA KIT
At HS Analysis, we take a comprehensive approach to slide analysis. We don’t just analyze the slides themselves, but we also integrate our solutions within the existing infrastructure. This includes connecting to LIS (Laboratory Information System) and naming the slides in a way that makes them easy to save, search, and use for medical purposes. Our goal is to provide a seamless experience for our clients, allowing them to access and utilize the data they need quickly and efficiently.
AI based analyses using HSA KIT would provide:
- Standardized process with subjective/objective analysis
- Extraction of relevant features from raw data and create meaningful representations for training AI models
- Module selection and configuration without excessive coding
- Easy to learn software: Annotate , Train and Automate
- Quick and efficient analysis of multiple medical images which cuts down time for diagnosis or treament
- Automated report generation to boost productivity and help physicians or radiologists in evaluation process

The HSA KIT software is designed to seamlessly integrate into existing laboratory information systems (LIS), enabling seamless data exchange and interoperability. This integration streamlines the entire workflow, from sample collection to report generation, minimizing manual data entry and reducing the chances of transcription errors. Real-time data synchronization between the HSA KIT software and the LIS ensures that all relevant information is readily accessible, enabling a smooth and efficient diagnostic process.
Furthermore, with HSA Case Veiwer it becomes incredibly easy to store client files in a much more organized way. We provide a smart data management system with HSA KIT that makes structured data available for case-based workflows. Our system is a useful tool to streamline operations because it enables users to quickly organize and analyze data. Furthermore, the sophisticated features guarantee data security and privacy, providing users with comfort when handling sensitive information.

We understand the importance of having accurate and efficient slide analysis software. That’s why we offer a range of features to help you achieve your goals.
- Our software is compatible with both Linux and Windows operating systems, and it runs smoothly in Docker. With offline functionality, you can work on your slides without an internet connection, but if you need to extend to online use, that’s possible too.
- We also offer professional integration into your network infrastructure, so you can seamlessly incorporate our software into your existing systems.
- Our software is designed to work with other programs as well, ensuring that you have all the tools you need at your disposal.
- Even on weaker computers, our software delivers full performance, so you can analyze slides quickly and accurately.
- And with the ability to generate reports in CSV and Excel formats, you’ll have all the data you need at your fingertips.
- Finally, user profile management ensures that each user has their own history and preferences stored for easy access.

Over a short period of time, HS Analysis GmbH has partnered with numerous companies, hospitals and laboratories as clients which provide microscopic slides or data that needs to be analysed. The physical slides can be digitalised to whole slide images (WSI) with the help of HSA KIT software that can be integrated to commonly used microscopes, and data can be retrieved in the form of reports and atomated graphical representaions. This helps to eliminate the extensive process that is usually practiced by medical professionals.

AI based analyses can be way more efficient, however it can only act as a supportive tool to human expertise and never be a complete alternative.
AI algorithms have the tendency to produce false positives and false negatives, and may have trouble adapting to a data that deviates from training dataset.
With our advanced technology and expert team of professionals, we are confident in our ability to deliver top-notch slide analysis services that meet the unique needs of each individual client.
Whether you’re looking for a one-time analysis or ongoing support, we have the tools and expertise necessary to help you achieve your goals.
Why Choose HSA KIT for FL Data Analysis
Single Channel Simplicity
The HSA KIT makes it incredibly straightforward to work with single-channel FL data. Its user-friendly interface allows for quick and efficient data processing, reducing the learning curve for new users.

Multi-Channel Flexibility
For those looking to analyze 2 or 3 channels simultaneously, the HSA KIT offers an equally seamless experience. This feature is particularly useful for complex analyses that require multichannel data.

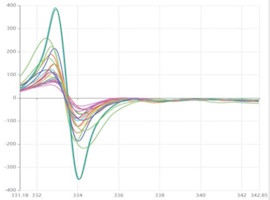
Enhanced Histogram View
The HSA KIT provides a histogram view for a more detailed understanding of your data distribution. This feature allows you to quickly identify patterns or anomalies that may not be immediately apparent in other views.

Whole slide images (WSI)

The first WSI scanners, introduced in the late 1990s, were quite primitive compared with their contemporary counterparts.7 Prior to the introduction of WSI, digital imaging in anatomic pathology relied largely on microscope mounted cameras to produce “static” digital images.2 These static images were of limited clinical utility because they captured only specific regions of a glass slide. Robotic microscopy was accordingly utilized because it allowed the telepathologist to remotely review an entire glass slide.
Whole slide imaging (WSI) is a technology that involves scanning a complete microscope slide and creating a single high-resolution digital file. whole slide imaging offers numerous advantages in pathology, including improved collaboration, accessibility, efficiency, archiving, and education. It is a valuable tool that is transforming the field of pathology. Deep learning has been applied to WSI for various tasks, including segmentation and analysis of liver images.
Deep Learning in HSA KIT
HSA KIT harnesses the power of deep learning, a subset of machine learning characterized by multi-layered neural networks, to revolutionize histopathological analysis. This transformative approach allows HSA KIT to process vast amounts of histopathological data with unparalleled efficiency Automated image analysis, a core feature, enables the detection and annotation of various structures and abnormalities on slides, reducing manual intervention and enhancing consistency.
Beyond mere visual analysis, HSA’s models integrate molecular data, offering a comprehensive understanding of samples. The continuous training of these deep learning models ensures they remain updated with the latest research, refining their predictive capabilities over time.
One of the standout features is real-time analysis, providing instant insights as slides are scanned, bridging the gap between data acquisition and actionable results.
The precision offered by these models is unmatched, ensuring detailed and accurate annotations crucial for medical researches. Furthermore, as the volume of medical data grows exponentially, HSA’s deep learning approach scales seamlessly, maintaining its accuracy and speed, making it a pivotal tool in modern medical diagnostics.


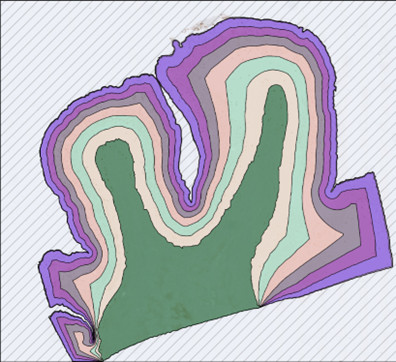
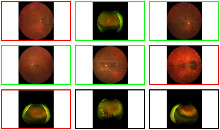
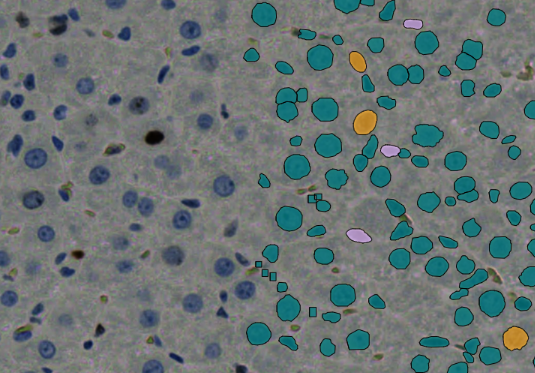
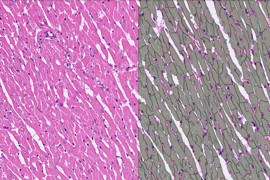
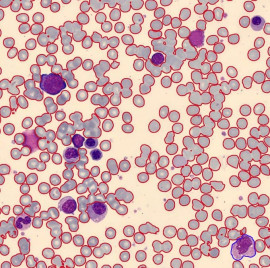
DL model visualization
After the ground truth data required were produced for each key markers, a DL model was trained. And the visual results of the model implementation could be seen in the following examples for all key markers.