Abstract
- Using the bar chart automatically generated in the HSA KIT, it is possible to compare groups in terms of the number of gH2AX signals under different conditions (e.g., incubation duration of a specific substance, intensity of a substance, animal age, etc.). Additionally, the total area of the gH2AX signals, plotted against the total tissue area, can be compared both between groups and within each group.
- High values of accuracy (= 0.962), precision (= 0.966), recall (= 0.995) and F1-score (= 0.980)
- A lot of use cases:
- To improve new drugs against tumor like prostate cancer
- to improve new drugs to protect organs like the kidney
Radioligand therapy aims for the selective elimination of tumor cells through focused radiation. Nevertheless, additional therapeutic options arise in the context of radionuclide therapy. A promising strategy involves the potential combination of radionuclide therapy with the use of protectors for cancer treatment. This approach proves particularly relevant since the administered radiation can also affect surrounding tissue. For example, if the tumor in the kidney is treated with radiation, the surrounding healthy kidney tissue is also destroyed. To minimize the undesirable impact on healthy tissues, the use of protective substances could be considered before radiotherapy. The following details how such a trial at its core could look and how it is efficiently supported by the HSA KIT.
gH2Ax signals
Intra- and extracellular influences, such as radioactive radiation during radioimmuntherapy, can cause mutations or DNA double-strand breaks (DSBs). After induction of DSBs, phosphorylation of the histone H2A variant H2AX occurs within a few minutes (gH2AX). It can pose potential dangers to the cell and thus to the entire organism. Depending on the extent of the damage, programmed cell death (apoptosis) can be triggered or the cell can undergo necrosis. Because of that laboratorys are searching for a substance to protect subsidiary organs during radioimmuntherapy. For the verification of the effect of these, the “gH2AX Analyzer” in the HSA KIT can be used to quantify the gH2AX-Signals, which correlate to the DSBs.
Advantages of the HSA KIT
- Evidenced-based development: The HSA KIT is based on evidence from experiments. Projects are archived, allowing data to be traceable even after 2 years. This ensures that the settings and parameters used can be retraced, even after a long period of time.
- Easy modification: Modifying experiments is made simple with the Copy-Tool feature of the HSA KIT. It enables the quick copying of projects, preserving previous data. A new project with a new IP is created, ensuring that no previous data is lost. Subsequently, new processing and parameter adjustments can be made, facilitating easy comparison of data and potential evaluation.
These features of the HSA KIT enhance data traceability, enable efficient modifications, and facilitate effective evaluation of experimental results.
Use cases
- The HSA KIT can be used to assess the impact of varying different substances, substance concentrations, incubation durations, radiation intensities, multiple administrations, and similar factors on the intensity of the damage.
- Neoadjuvant therapies can be investigated, as well as different radioisotopes such as the alpha emitter actinium-225 or the beta emitter lutetium-177.
- The efficiency of targeted radiopharmaceuticals can be investigated relatively easily, quickly, and comprehensively.
- A statement can be made about which antibody-drug conjugates demonstrate how much effectiveness.
- The model is so sensitive that it can be applied to both the kidney, the liver, and tumors.
- The bar chart generated automatically in the HSA KIT allows for the comparison of groups based on the number of gH2AX signals under various conditions (e.g., incubation duration of a specific substance, substance intensity, animal age, etc.). Furthermore, the total area of gH2AX signals, juxtaposed against the total tissue area, can be compared both among different groups and within each specific group.
Click here to read a blog about a real experiment using the HSA KIT:
Slidescanner

The HSA kit can recognize and analyze digitally generated microscopy images from slide scanners (such as the Axio Scan Z.1). This includes supporting image formats like .tiff, .czi, and .jpg.
Implementation & Training
The HSA kit can recognize and analyze digitally generated microscopy images from slide scanners (such as the Axio Scan Z.1). This includes supporting image formats like .tiff, .czi, and .jpg.
To optimize the detection of gH2AX signals, two deep learning models were trained. The first model, called “HyperNonVesselNet,” is designed to detect erythrocytes and blood vessels. It divides the entire kidney into non-vessel and vessel areas. The goal is to identify the relevant areas or objects in an image and separate them from the background and/or other objects.
The second model, “HypergH2AXNet”, is applied as a substructure within the non-vessel area.
The ground truth data (GTD) used to train the deep learning model is created using the HSA KIT software.
The “HypergH2AXNet” model was trained for the quantification of gH2AX signals. The training process was time-consuming, involving several optimization approaches that were considered, executed, and the results were verified.
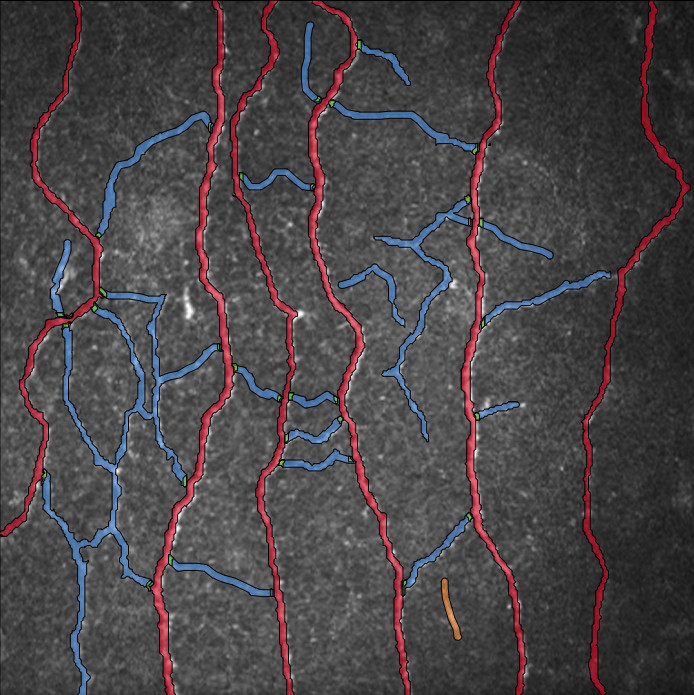
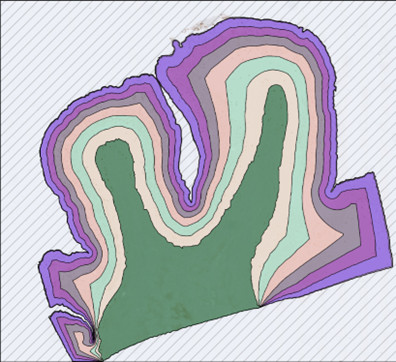
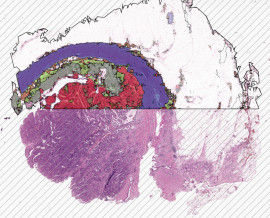
The following figure shows a kidney which is quantificated with the HSA KIT. The yellow structure presents the Non-Vessel are, the red structures the erythrocytes and blood vessel, the black structures the gH2AX-Signals.
Signal detection with the HSA KIT in mouse kidney
In order to verify the plausibility of the software results, the sections were individually examined. All structures automatically identified by the HSA KIT were considered, including the non-vessel area, erythrocytes or vessels, and gH2AX signals. Initially, the entire kidney was examined to rule out major errors. Subsequently, using a mouse kidney as an example, the displayed and hidden structures were compared.


The base ROI (Region of Interest), mentioned earlier, is represented by the black outline of the kidney. This defines the area to be quantified, and all detected and analyzed signals are located within this marking. The area outside this marking is filled with black diagonal lines, indicating that this region is excluded from quantification. The red-marked structures represent erythrocytes or vessels. Due to the automatic detection of these structures, the exclusion of blood vessels and red blood cells does not need to be performed manually. This allows for the definition of the non-vessel area, depicted in yellow. Within this area, the gH2AX signals are quantified, represented in black. For result calculation, the non-vessel area serves as the basis for the entire kidney, as it contains only cells where potential DNA damage can occur.
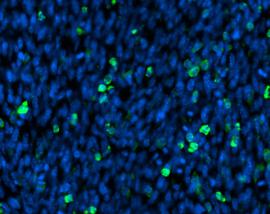
Additionally, to assess the quality of the results, the staining detected as signals is displayed and hidden, and examined. The latter was done to facilitate a better comparison to determine whether these locations represent signals or not. Image sections were captured at a 40x magnification in the HSA KIT and later compared in the course of the study.

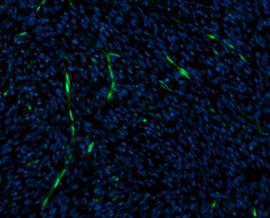
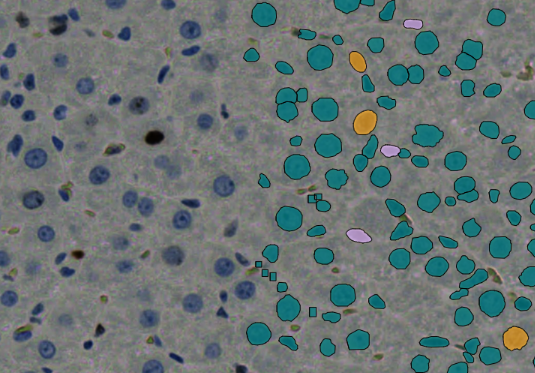
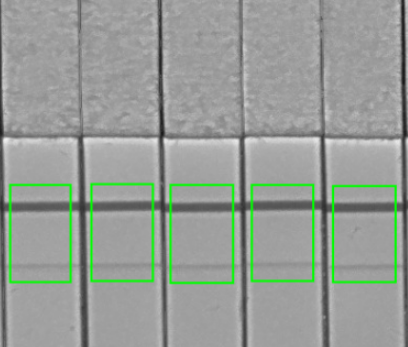
The structures detected as signals are highlighted in green in Figure Xa. The red-marked area was identified by the software as an erythrocyte. The non-vessel area, which would typically appear in yellow, has been hidden in both image sections for a better overview. It can be observed that no signals are detected within the erythrocytes. As an example, red blood cells within the image are circled in purple. These structures are characterized by a hollow space filled with yellowish, irregular structures. Both the hollow spaces and the structures within them can vary in size and shape. The model was trained to only detect larger blood vessels and blood cells (>100 μm), as smaller ones are often present between cells (purple) and do not have a negative impact on the quality of the results, as the model does not falsely detect them as positives. Further details on this and the training process were explained in section “Training”. As can be seen in the image section, these structures were not detected as signals. Moreover, no structures in this image section were falsely identified as gH2AX signals, indicating that no false-positive results were generated at this location. Additionally, the image section shows that no false-negative signal was detected. Every distinct signal, regardless of its size, present in Figure a was correctly detected by the software. Therefore, the error rate at this point is 0% for both false positives and false negatives.
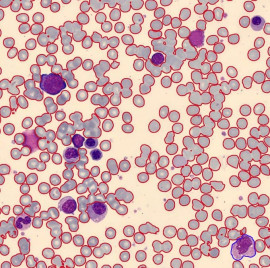
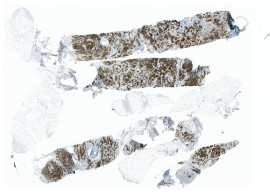
Detection in tumor
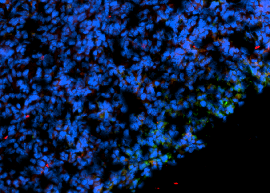
The model can also be used to detect gH2AX-signals in other tissues and organs. The following paragraph describes the evaluation of a tumor using the HSA KIT.


It is evident that the blood vessels and red blood cells (erythrocytes) have been recognized as such (in red). The rest of the tumor, where cell nuclei and thus DNA double-strand breaks could be present, has been detected as the non-vessel area (in yellow). In this area, DNA double-strand breaks were identified in the form of gH2AX signals (in green).
The following excerpts provide a more detailed view of the signal detection.


Here, the previously mentioned structures are also identifiable, including the erythrocytes (in red), the non-vessel area (in yellow), and the gH2AX signals (in green).
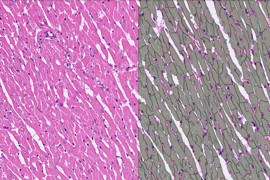
Detection in liver
This section illustrates the signal detection of the HSA KIT (software) in the liver of a mouse.


With the HSA KIT, it is possible to detect gH2AX signals not only in the kidney but also in other tissues, such as tumors and the liver. For a better overview, the application on the kidney was examined more closely throughout the blog.
Automated area calculation of the gH2AX signals with the HSA KIT
The file names in the following section were created fictitiously and do not reflect the real outcomes of the experiment, but rather the actual process.
The scanned OTs were analyzed using the HSA KIT. The parameters were optimized and adjusted according to the staining intensity by applying and verifying various settings, which will be explained in more detail later. The goal was to capture the entire area of each distinct signal and minimize the detection of unspecific staining and red blood cells.
Through comparing the results of different settings, a Confidence value of 0.70 was found to be optimal. This parameter indicates the software’s level of confidence in the signals it detects, ranging from 0 to 1. Additionally, a range of 0 to 5,000,000 μm2 was set for the size range in which signals should be detected. Since the areas of DNA double-strand breaks can vary greatly, this option was not further considered.
Once the parameters were optimized, the model was applied to the samples, and the area of the gH2AX signals was automatically calculated by the software. The total areas of the kidneys were also automatically calculated, allowing for a comparison between the total damage areas and the kidney areas. In addition, the percentage of damage within the triple determinations was averaged, and the standard deviation was calculated (Table 1).

To visualize these values, the HSA KIT created a bar chart representing the percentage of DNA damage relative to the total area of the kidney. The averaged values of damages from the 3 treated animals per group and time point were used. The standard deviations were also included.

In addition to the total damage area relative to the total kidney area, the HSA KIT automatically generates a column chart that indicates the total number of γH2AX signals per mm2 for each animal.

It can be observed that the animals from group 1 incubated with the substance for only two hours (darkblue bars) have incurred a less amount of damage. The bar representing the 15-hour values of group 1 (orange) shows the lowest level of damage. The animals from group 2, which were incubated for 2 hours (grey) indicate a similar level of damage as group 3 (green). The group 3, which shows the highest damage, was incubated for 2 hours (light blue).
The column chart suggests that the group number has an impact on the extent of DNA damage. When the incubation period remains constant (2h or 15h) and only the group number changes, altering the concentration of the substance, the number of damages significantly increases.
The inserted standard deviations do not show a clear pattern of increase or decrease.
Models used for signal detection
With the HSA KIT, it is possible to adjust certain parameters according to the sections. Care was taken to choose these parameters in a way that allowed for the automatic detection of as many manually identified γH2AX signals as possible. Additionally, the entire area of these signals was considered, as later in the study, the calculation of the signal area was intended.
The recall value of the model “Hypergh2axNet” was 0.995, and the precision value is 0.966, indicating that there were more false-positive results (i.e., a signal being detected when it wasn’t present) than false-negative detections. This could be observed from the number of false negatives (FN) and false positives (FP). However, none of the calculated values deviate significantly from 1, suggesting that the model is suitable for the accurate quantification of γH2AX signals. The harmonic mean, F1-score, is 0.980, further confirming that this is an appropriate deep learning model.
Metrics
To further investigate the quality of the model, metrics were calculated. For this purpose, a region of a kidney was selected, and gH2AX signals were manually detected.


In the next step, a comparison was made with HSA KIT to determine which manually annotated signals were automatically detected by the model and which ones were not. Based on this, the values for the number of FN (false negatives), TN (true negatives), FP (false positives), and TP (true positives) were counted.
The following values were obtained:
FN: 2
TN: indeterminable
FP: 15
TP: 432
Using these values and equations (1.1) to (1.4), the metrics accuracy, precision, recall, and F1-score were calculated. Since the TN values are indeterminable, they were not further considered. The following values were determined:
Accuracy = 0.962
Precision = 0.966
Recall = 0.995
F1-score = 0.980
The recall value is the highest among all the values, followed by the F1-score. The precision value is slightly higher than the accuracy.
HSA KIT vs. ImageJ vs. QuPath
HSA KIT

ImageJ

QuPath

To compare the Results better we used a zoomlevel of 80.
HSA KIT

ImageJ

QuPath

After that the solutions were summarized in a table.

With these data a column chart was created where the blue column is the HSA HypergH2AXNet, the black column ImageJ and the last one (yellow) QuPath. The metrices precision, recall and F1-score were calculated for each of them to compare the methods better.

If you compare all of the columns you can see that the model “HypergH2AXNet” the column with the highest average score of all the models have. ImageJ and QuPath are approximately on the same level.