High-Precision PLA Analysis in Human Kidney Sections
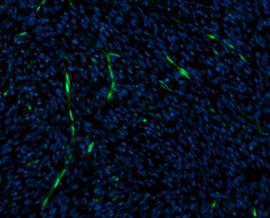
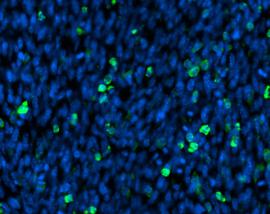
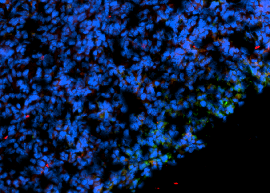
The module PLA Analyzer enables highly precise analysis of PLA-stained human kidney sections. AI-based image analysis automatically detects glomeruli and distinguishes glomerular from non-glomerular tissue regions.
The results are stored in a structured format and allow reliable quantification of PLA signals inside and outside glomeruli.
Automatic Detection of Glomerular and Non-Glomerular Regions
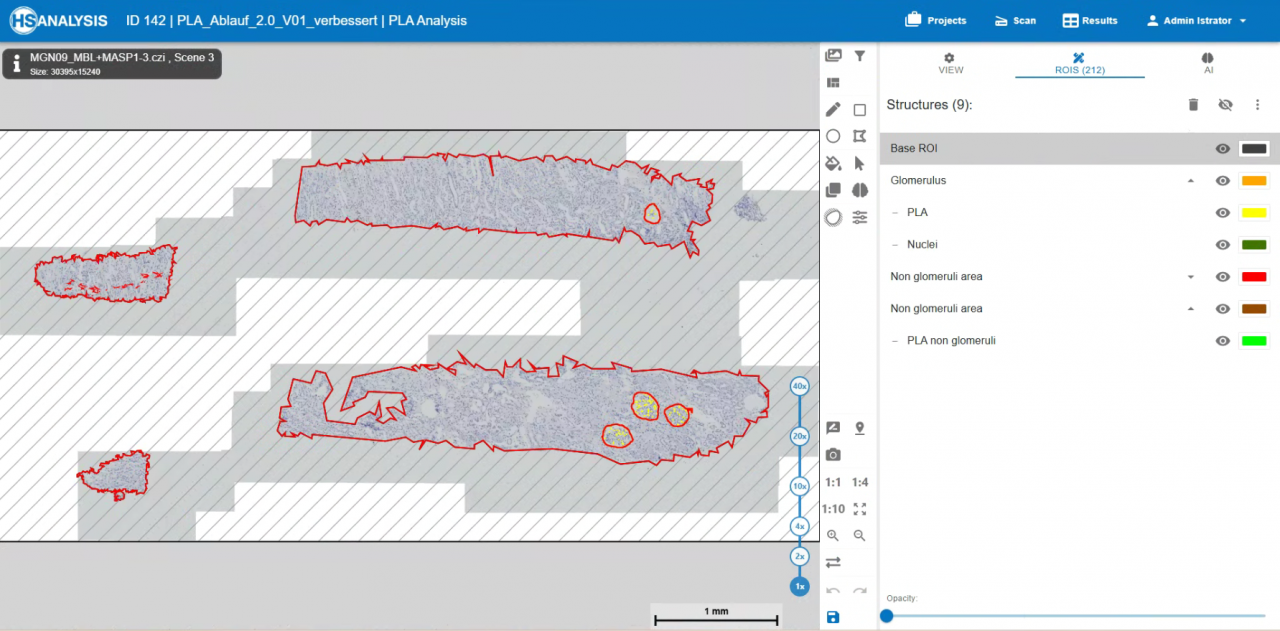
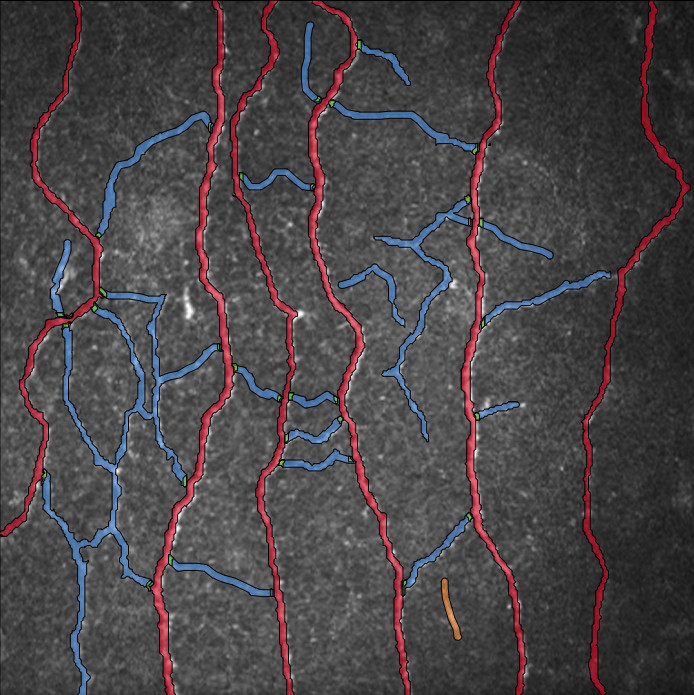
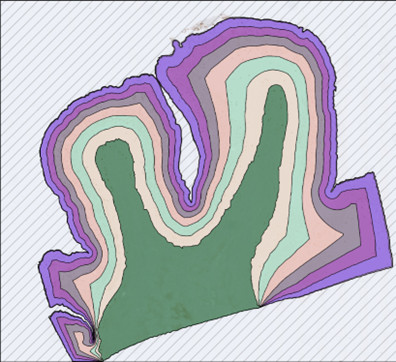
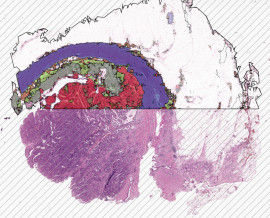
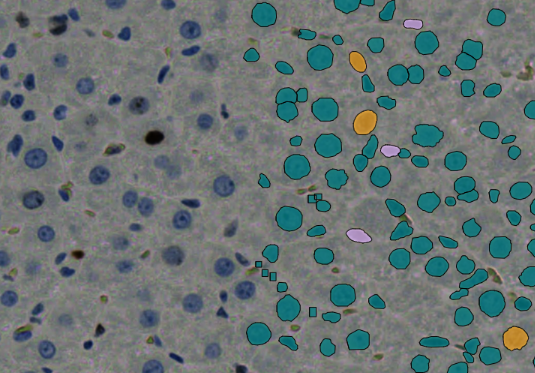
The PLA Analyzer automatically detects glomeruli in human kidney sections and separates glomerular from non-glomerular tissue areas using trained AI models.
This enables a precise spatial assignment of PLA signals to the relevant anatomical compartments.
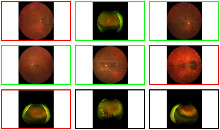
The analysis results are visualized directly on the tissue section, allowing detected structures and quantified signal regions to be reviewed immediately.
This provides a transparent and traceable basis for the evaluation of molecular interactions in kidney tissue.
The automated workflow supports consistent analysis across large datasets while reducing manual effort and observer-dependent variability.
Structured Quantification of PLA Signals
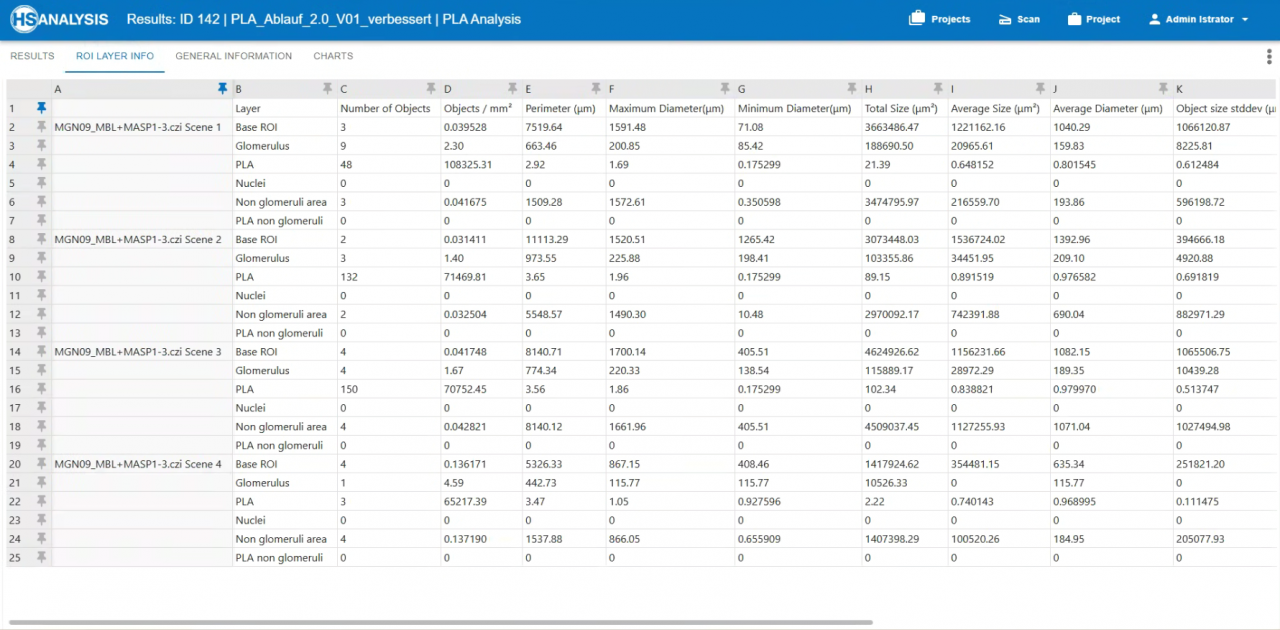
All detected structures and quantified PLA signals are automatically summarized in structured result tables.
For each sample, relevant parameters such as tissue region, signal distribution, and additional quantitative features are stored.
The results can be evaluated at different levels, for example:
- within glomeruli
- outside glomeruli
- per tissue section
- across entire study cohorts
The structured data organization allows results to be efficiently filtered, compared, and exported for further statistical analysis and clinical evaluation.
Visualization of PLA Signal Distribution
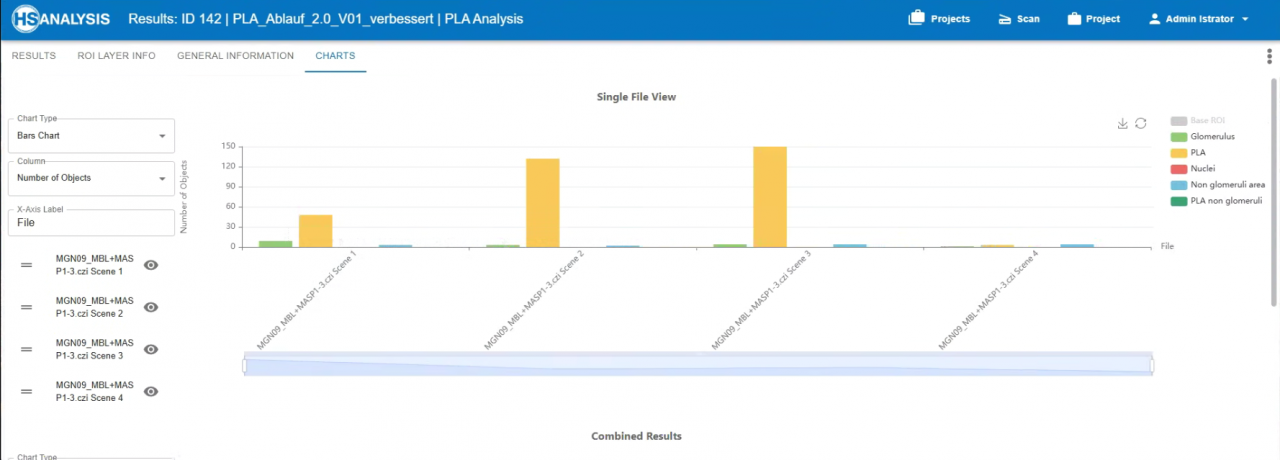
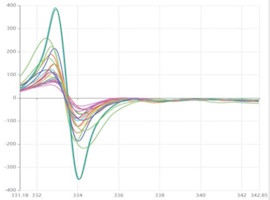
In addition to tabular results, the module automatically generates clear visualizations of PLA signal distribution.
Charts show, for example, the proportion of signals within glomerular and non-glomerular regions across individual sections or entire study cohorts.
These visualizations provide a quick overview of experimental and clinical results and support direct comparison between different samples and groups.
Differences in PLA signal distribution can therefore be identified immediately and interpreted in the context of molecular interactions and pathological changes.