Nanopore Analysis with HSA KIT
Welcome to the forefront of molecular measurement innovation. Our cutting-edge software revolutionizes how nanopore experiments are conducted and analyzed , transforming complex data into actionable insights. Designed for precision and efficiency, our solution automates baseline detection, anomaly identification, and signal characterization, enabling a focus on what truly matters: discovery.
Deep learning is at the heart of our evaluation process, enhancing the accuracy and speed of interpreting vast datasets. By leveraging advanced neural networks, our platform can detect subtle patterns and anomalies within nanopore experiment results that may otherwise go unnoticed. This approach not only accelerates the analysis process but also increases the reliability of the findings, providing deeper insights into molecular interactions and dynamics.
Whether you are probing analyte interactions or exploring the depths of concentration analysis, our robust platform adapts seamlessly across various research applications, making it an indispensable tool for advancing your experimental outcomes.
HSA KIT- exploring experimental data with Deep Learning
Our Nanopore module within HSA KIT, is engineered to tackle the complexities of nanopore experiment results with precision and adaptability. Key capabilities include:
- Automated Signal Processing: The module swiftly processes raw data, filtering out noise and enhancing signal clarity. This ensures that the analysis is based on high-quality, refined data
- Pattern Recognition: Utilizing convolutional neural networks (CNNs), the module identifies intricate patterns within the data that are critical for accurate molecular characterization
- Anomaly Detection: The deep learning model excels at detecting anomalies or rare events that may indicate significant biological phenomena, providing insights that might otherwise be missed
- Adaptive Learning: As more data is processed, the module continuously improves its accuracy and efficiency through deep learning, adapting to new research scenarios and data types
- Real-time Analysis: Designed for speed, the module is capable of processing and analyzing data in real-time, facilitating faster decision-making during experiments
Use Cases: Expanding research applications
Beyond analyte measurements, our deep learning module supports a wide range of research applications, including:
- DNA Sequencing: Enhance the accuracy and speed of sequencing by efficiently identifying nucleotide sequences and structural variations
- Protein Characterization: Analyze protein-protein interactions and folding patterns, providing valuable insights into biochemical pathways and functions
- Pathogen Detection: Rapidly identify viral and bacterial signatures in biological samples, aiding in disease diagnosis and epidemiology studies
- Drug Discovery: Evaluate the interaction of potential pharmaceuticals with target molecules, accelerating the drug development process
- Environmental Monitoring: Detect trace amounts of pollutants or toxins in environmental samples, supporting sustainability and regulatory compliance efforts
Our platform’s versatility ensures it meets the demanding needs of various scientific disciplines, making it an invaluable asset for advancing research frontiers across multiple fields.
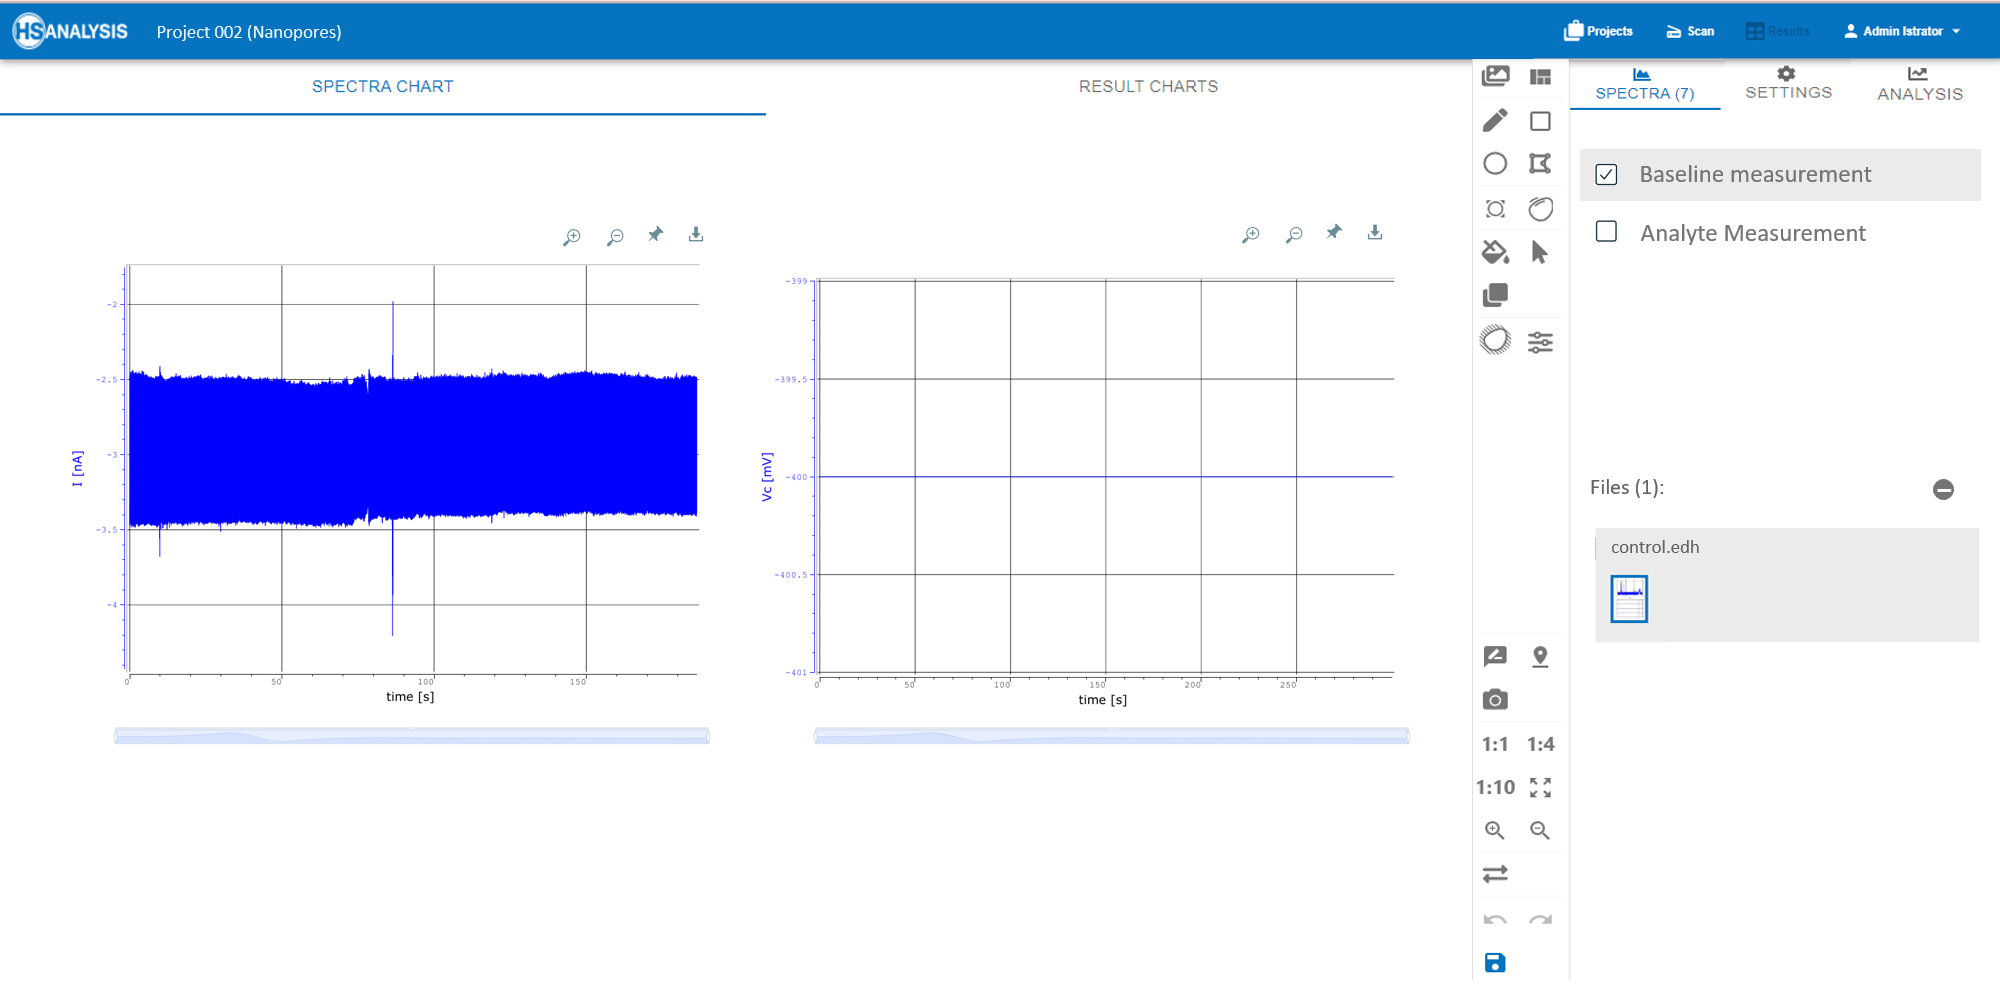
Analysing Molecular measurements with HSA KIT
Our Nanopores module is designed to seamlessly automate the analysis of analytes, optimizing both accuracy and efficiency. Here’s how it works:
1. Baseline Detection: The software automatically establishes a baseline noise level for each dataset. Using advanced algorithms, it distinguishes genuine signal peaks from background noise, ensuring that only significant data points are flagged for further analysis.
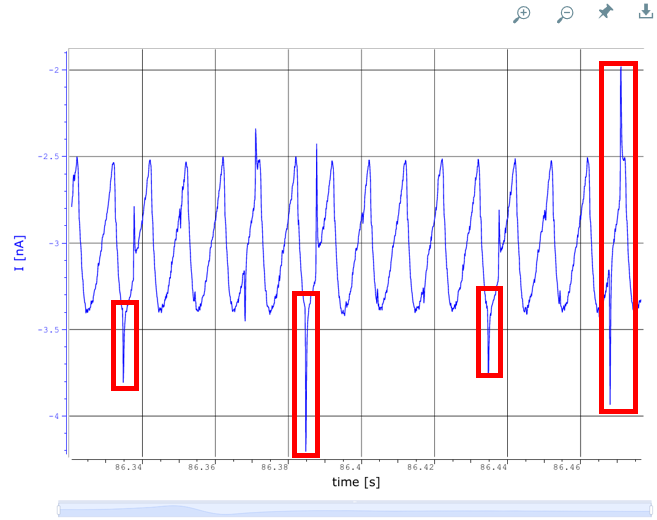
Once the baseline measurement is read, the amplitude (yellow) of the peaks is noted, and any signal which appears to deviate, is recorded as a negative signal (red).

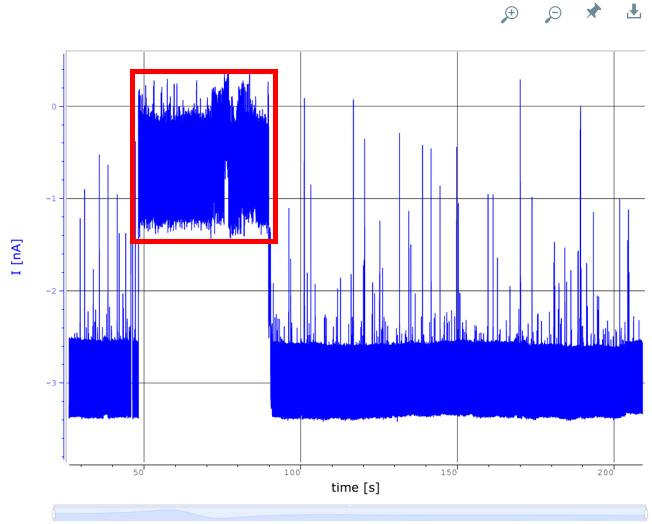
2. Signal Identification: Once the baseline is set, pattern recognition techniques are used to identify specific signal patterns associated with different analytes. This automation minimizes human error and accelerates the overall analysis process.
The process involves analysing signals after addition of an analyte A with high concentration (400 nM). The positive signal (yellow) data is compared with the baseline to check deviations.


Moreover, some deviations which point towards a possible nanopore malfunction (red), for example a shifted baseline for some period of time; are also detected. The readings are excluded from the analysis but their frequency is recorded for quality assessment.
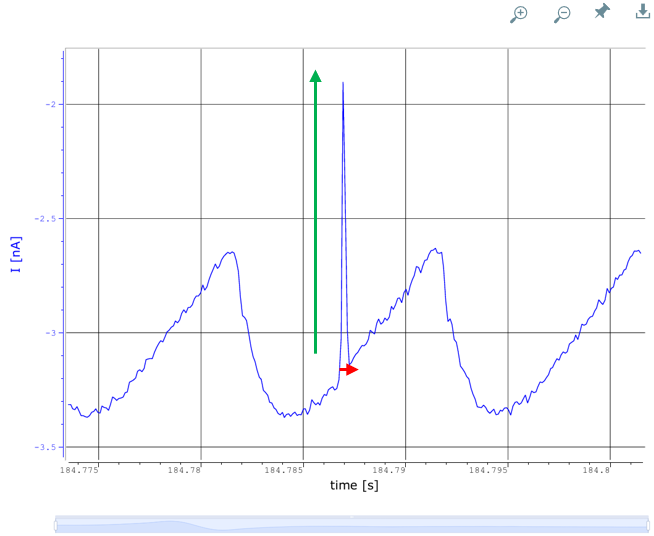
3. Signal Analysis: Once positive signals are identified, height and width of each peak is checked, and subordinate peaks are groups accordingly. The peak height (green) often correlates with the quantity or concentration of a specific molecule passing through the nanopore. Larger molecules or higher concentrations will typically generate larger signal changes. The width (red) can indicate the duration a molecule interacts with the nanopore. Longer interactions might suggest bigger or more complex molecules.
4. Concetration Analysis: For the same analyte, different concentrations can be studied to study their behavior. Positive signals are analysed for each concentration level, until there are no positive signals identified.
Such type of analysis have various advantages:
- Concentration-Dependent Interactions: Analyte’s interaction dynamics with the nanopore can be studied. This helps in understanding whether the analyte forms aggregates or complexes that affect signal characteristics.
- Sensitivity Analysis:This involves identifying the minimum concentration that produces a detectable signal.
- Generating Calibration Curves: By analyzing signals from known concentrations, calibration curves can be created that helps in quantifying unknown sample concentrations. This is essential for ensuring accurate measurements in experimental and real-world applications.
- Analyzing Binding Affinity:Concentration studies can reveal how strongly an analyte binds to a specific site on the nanopore or associated molecules, providing insights into binding affinity and kinetics.
- Saturation Points:Identifying saturation points where increasing concentration no longer increases signal assists in understanding binding site availability and analyte saturation behavior.
- Reproducibility Assessments:Conducting experiments across varying concentrations aids in evaluating the consistency and reproducibility of nanopore measurements. This ensures robustness and reliability of the observed data.
5. Threshold Adjustments: The software dynamically adjusts thresholds based on the real-time assessment of signal changes, enhancing its ability to detect subtle shifts in analyte concentrations.
6. Comparative Analysis: It is also possible to compare signals of two different analytes at different concentrations. This comparison can be done based on the results calculated for each analyte, for example: signal height, signal width, number of signal groups. According to such different characteristics, a classification model determines which analyte is present in unknown samples and estimate their concentration.
Why choose HSA KIT?
Customizable Parameters
The software provides users with extensive customization capabilities, accommodating various research needs:
- Flexible Experiment Setups: Users can tailor settings to fit unique experimental designs, specifying parameters like sampling frequency, sensitivity levels, and data processing workflows.
- Analyte-Specific Configurations: Each analyte can have individualized detection criteria, allowing researchers to optimize conditions based on molecular characteristics or experimental objectives.
- User-Friendly Interface: With an intuitive interface, researchers can easily tweak parameters without needing advanced programming skills, facilitating broader accessibility across lab teams.
Quality Assurance
Ensuring high standards of experimental integrity, the software includes robust quality assurance features:
- Real-Time Monitoring: Continuous monitoring of ongoing experiments is conducted, with alerts and notifications for any deviations from expected patterns, enabling prompt corrective actions.
- Error Detection: Built-in checks highlight discrepancies or unexpected results, prompting verification steps before proceeding with further analysis.
- Comprehensive Reporting: Detailed reports provide insights into data quality, including statistics on noise levels, signal consistency, and outlier occurrences, crucial for validating findings and documenting experiments.
These features collectively empower researchers to conduct precise, reliable analyses across diverse experiment types and analytes, while maintaining stringent quality controls throughout the experimental process.